03/17/2020
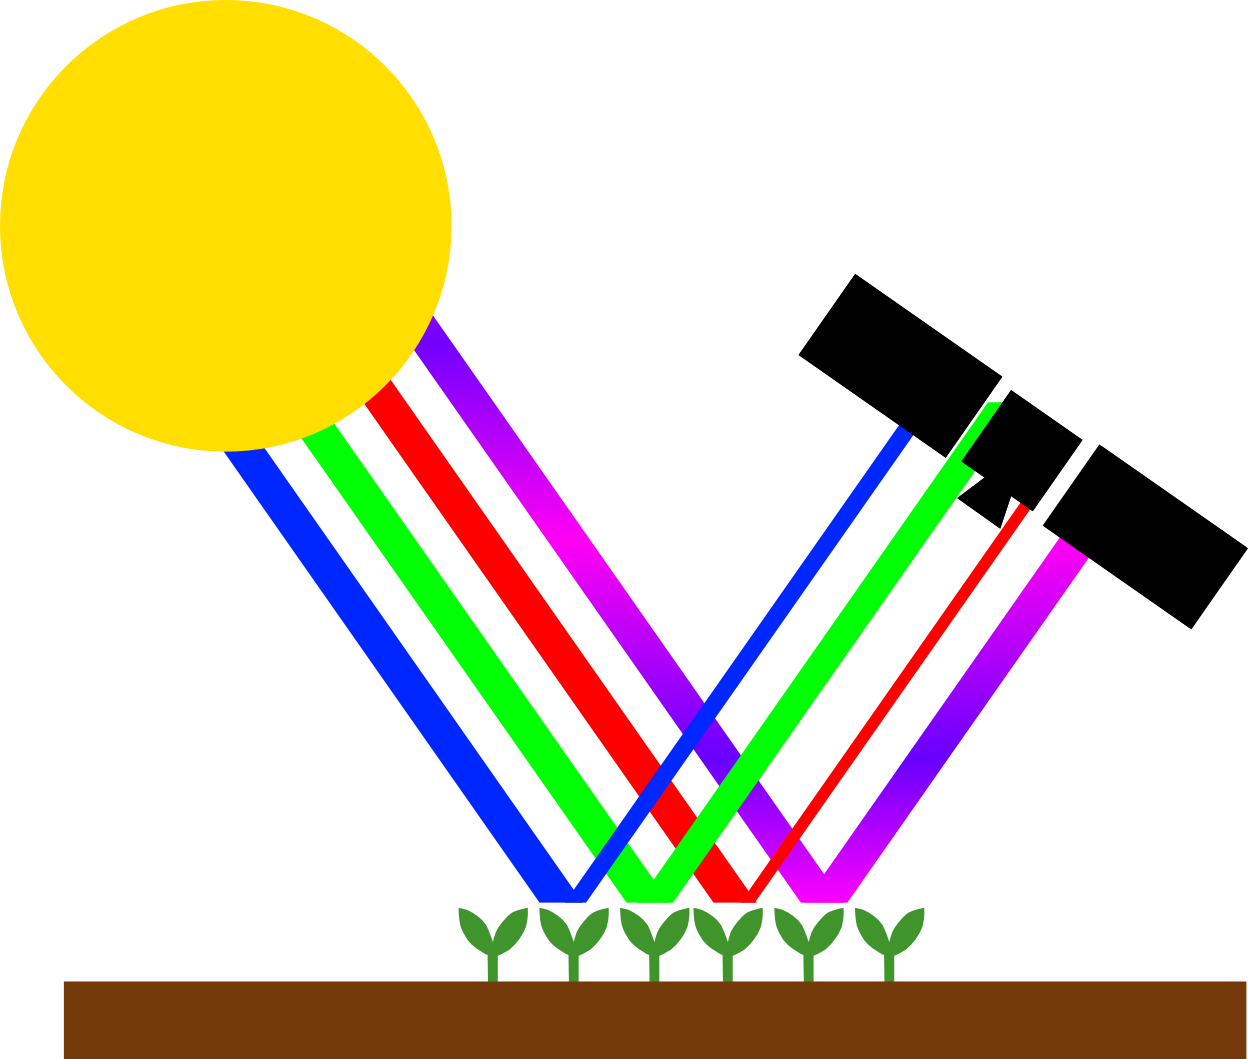
Satellite optical sensors collect information about how the Earth’s surface reflects sunlight. Technically, these sensors have a lot in common with ordinary cameras, but in addition to blue, green and red light, they also register light that is invisible to human eyes. These are primarily different ranges of ultraviolet and infrared light. The technical term for such sensors is “multispectral” – covering many parts of the electromagnetic spectrum.
Taking into account light outside the visible range allows us to detect various phenomena. In agriculture, the ratio of Near Infrared to Red reflection is particularly important. An index calculated on the basis of this ratio can be viewed in the SatAgro Explorer. More about the index can be found here.
A well-developed, healthy crop reflects a lot of green (that’s why it’s green to us) and infrared light (shown as purple-pink in the picture), but absorbs a lot of red and blue light. In the tab Explorer such areas have a green color (high index values).
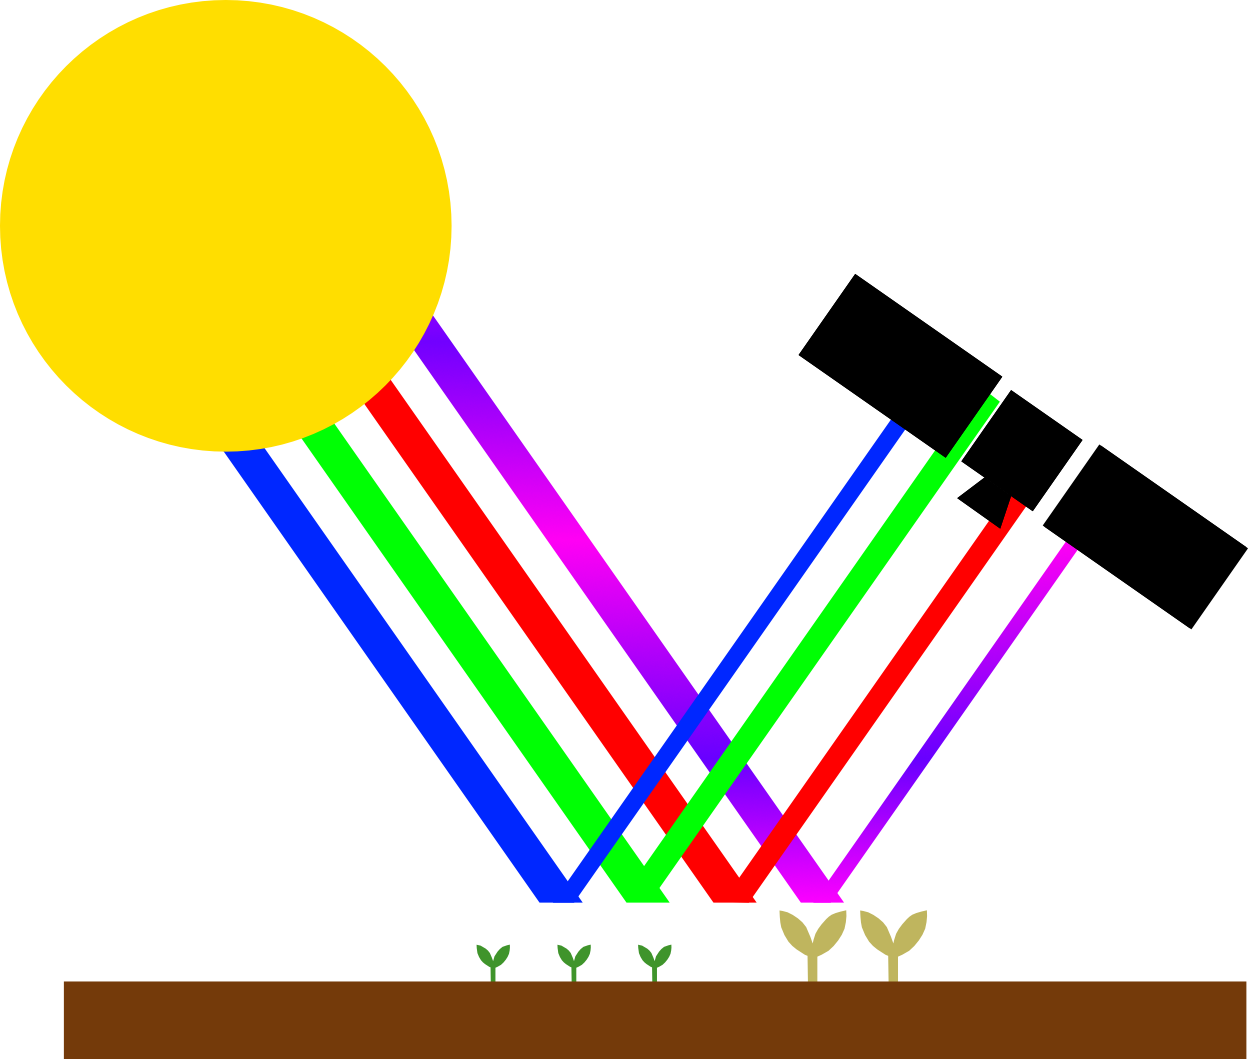
Conversely, poorly developed fields, dried out plants or exposed soil reflect little infrared light and more red than healthy plants. In the Explorer such areas have a red colour (low index values).
The vegetation index is a good illustration of the distribution of the biomass, but cannot be used to e.g. distinguish between weeds and cultivated plants; the same index value can also be associated with many factors. Before planning a fertilisation based on the index, it is good to compare what we see in the Explorer with our knowledge of the field.
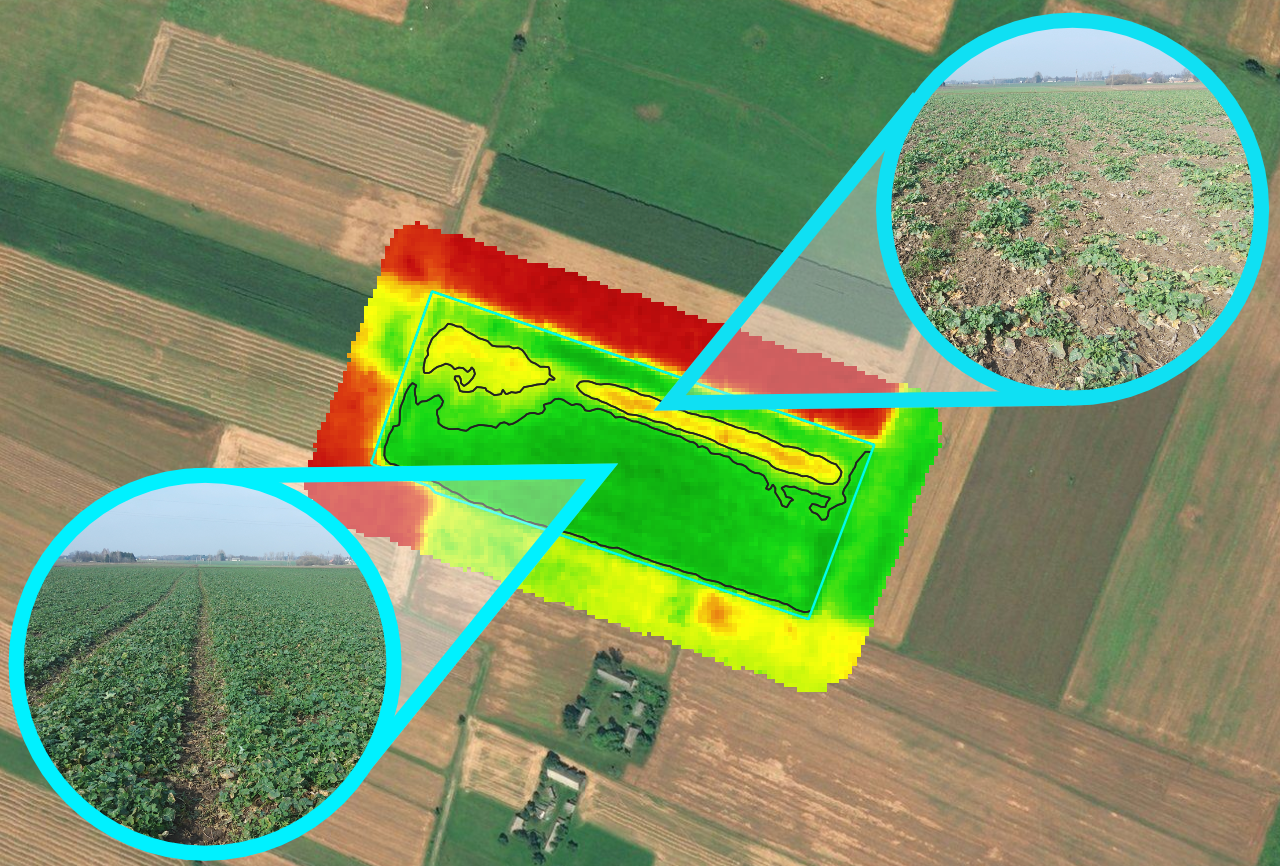
Below an example of satellite index vs photos from the field from one of SatAgro’s users – the yellow/red strip is where the seeder malfunctioned and oilrape seed was sown too deep. The lower plant density is nicely visible in the satellite image, and thanks to SatAgro fertilizer doses can be adjusted accordingly.
 Platforma