01/05/2020
To create a variable variable rate map based on the results of a soil survey, just follow these few steps – if you have already made a fertilisation map based on a satellite image, most of the process will be familiar to you.
1. Display the sampling results in the “Explorer”
Select “Soil sampling” from the “Show on map” list. The map will show the division of the field into zones, and on the left side of the map you will see a selection of characteristics/components.
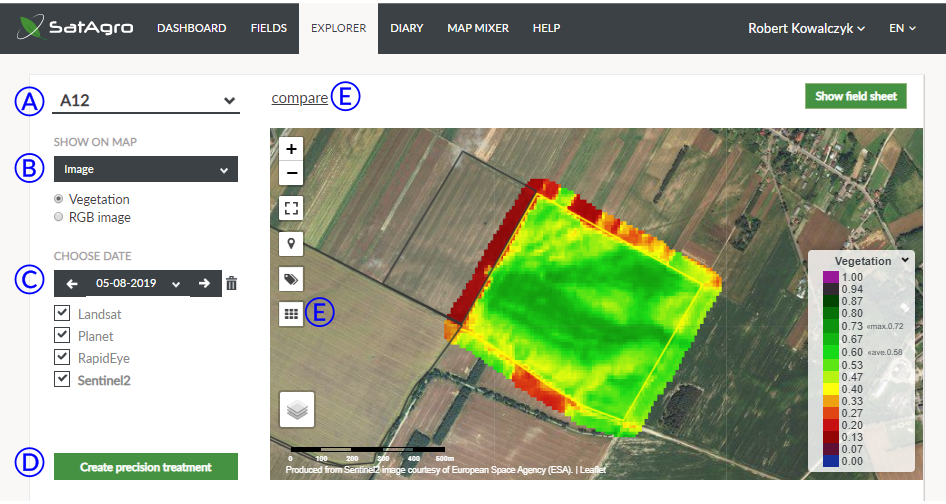
Select the soil property based on which you want to plan a precision treatment, e.g. for liming – pH. They are now visible:
– on the map – values of the property you selected in individual zones;
– to the left of the map, under the date selection – the green buttons “Create precision treatment” and “Show soil sampling details”.
2. Click on the “Create precision treatment” button
You have now opened the Precision Treatment Wizard. Give the treatment a title so you can easily find it later in the “Diary”. You can also add a description and change the date.

3. Specify the dosage parameters
Now it’s time for the most important stage of the process – defining how the system is to calculate the doses in each zone. Let’s go through all the parameters one by one:
Map source type – the type of map source in this case is Zones – we will determine the doses based on the results of soil tests within zones, not on the vegetation index from a satellite photo.
Dosing base – this is where we select the method for calculating doses.
User range:
The dose will be determined using a simple transformation of the soil properties tested (pH, potassium content). You define:
– minimum and maximum doses of fertilizer (Dmin and Dmax in the figure below)
– minimum and maximum soil property values (Xmin and Xmax).
SatAgro will calculate the dose in each zone based on soil property values, as shown in the figure – for zones with soil properties in the range of the minima and maxima specified (B) the dose will be calculated between minimum and maximum, zones with below the minimum will automatically receive the maximum dose (A), the most abundant zones will receive the minimum dose (C).
Dose vs soil properties
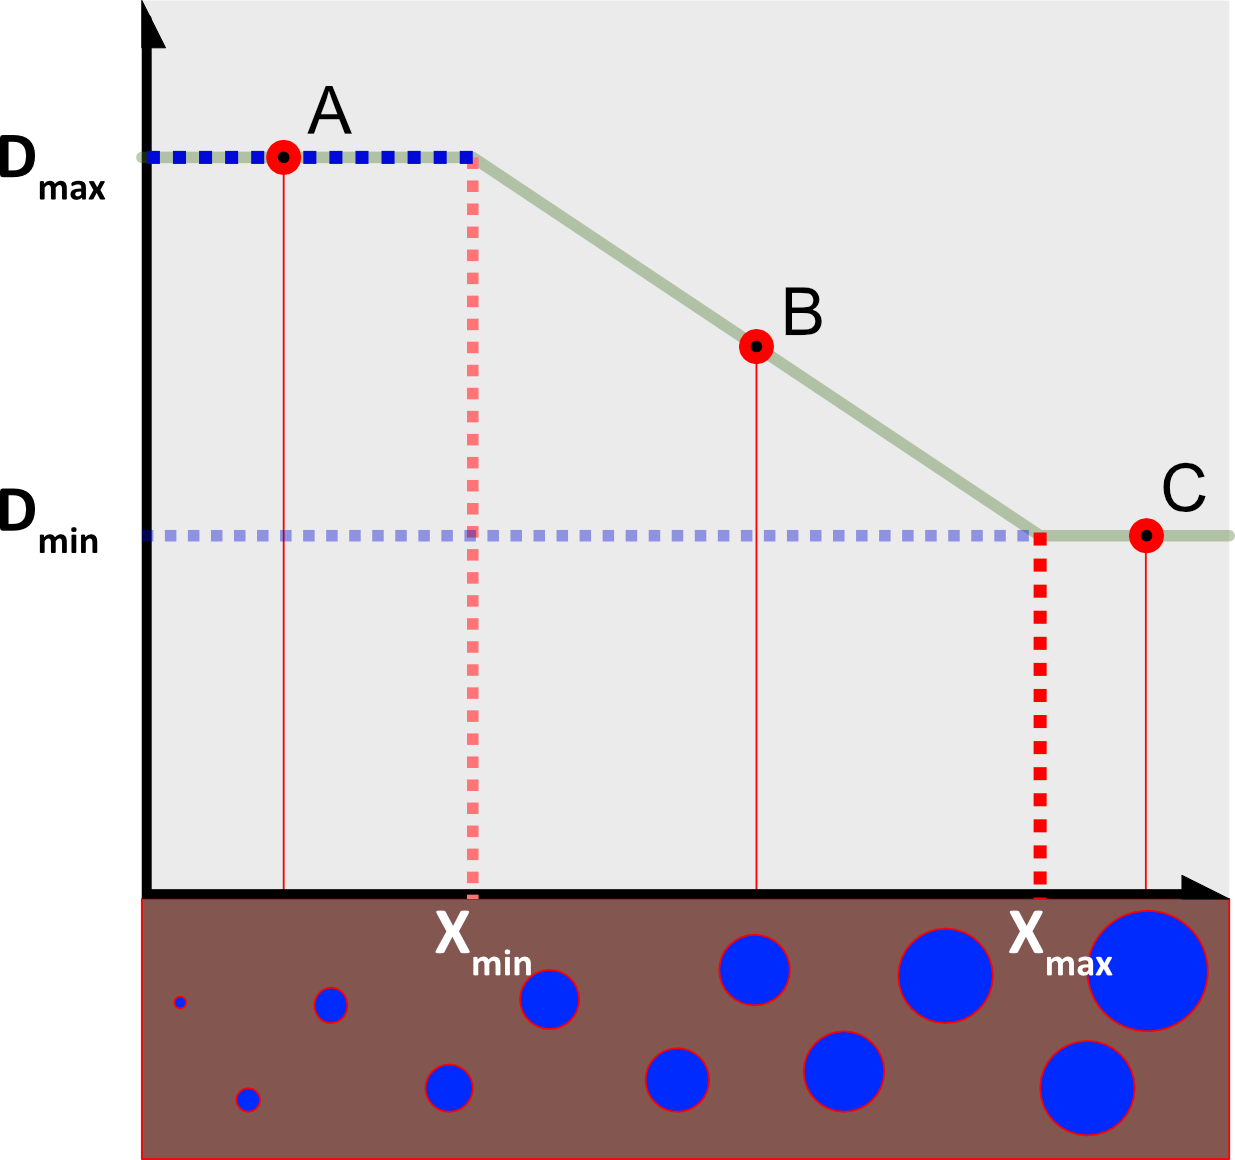
For example, if we think that the soil in a part of the field has acceptable acidity values (e.g. pH 6.5 and more), we can set the minimum dose to 0 and the maximum soil property value to pH 6.5. This will generate a map on which part of the field will be completely excluded from liming.
Abundance
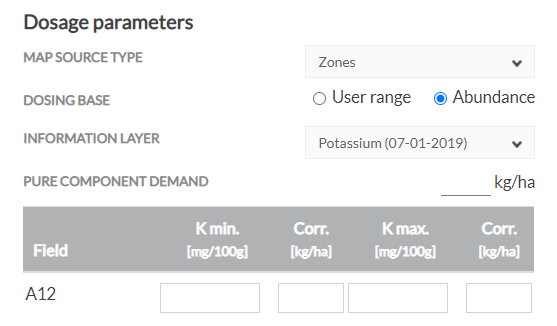
If we choose the abundance option, the parameters will change slightly. The most important difference: dose values here should be given in pure component values.
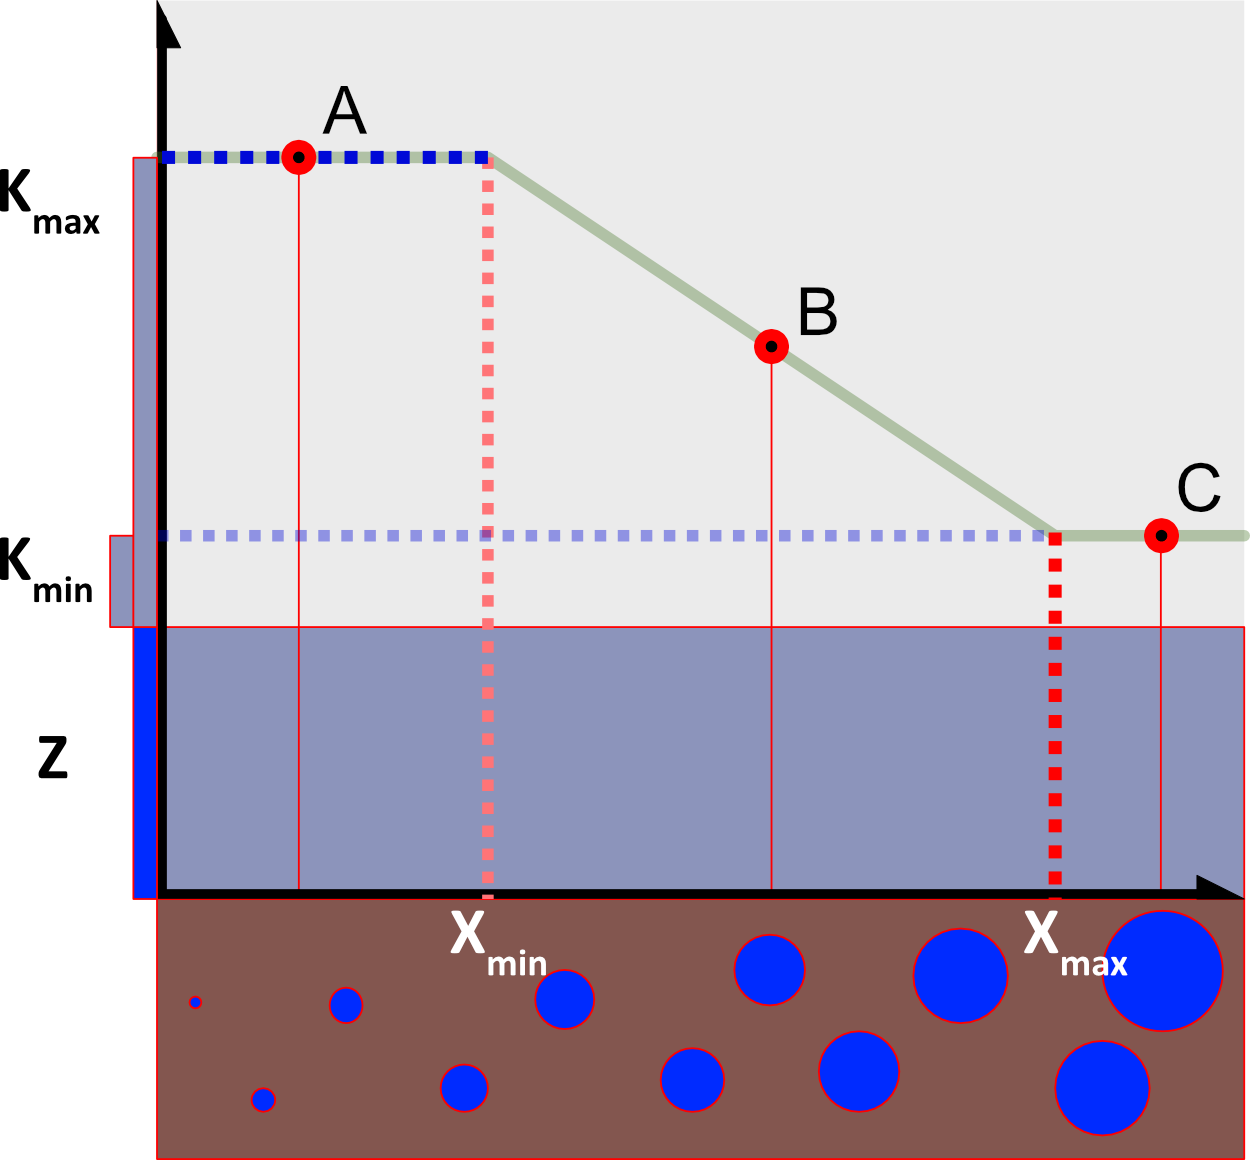
Pure component demand – here we give the base value that the crop requires (often provided by the seed producer). In the figure below, this parameter is denoted as Z.
In the table below, we determine how we will fertilise in addition to the base Z, as part of building long-term soil chemistry. In the least abundant parts of the field with values of Xmin and below we will determine the highest correction factor Kmax (here we will “sprinkle in” the most – A). In the best parts of the field with values of Xmax or higher the correction factor will be low or zero (Kmin, in point B). The correction values for particular soil types and classes can be found in agronomic tables.
Dose vs soil properties
Advanced options
Adjust to mean – in the “User range” dosage calculation mode you can adjust the dosage so that use of fertilizer over the entire field is equal to the average you specify.
Offset – in the “Abundance” dose calculation mode you can enter a percentage multiplier
Smoothing level – if you suspect that the boundaries used for the soil test are too sudden and soil chemistry changes more continuously, you can smoothen the dosage map – intermediate zones will be created and the doses will change more gradually. If you select the smoothing option, new parameters will appear. The smoothing level determines how much zone boundaries are to be blurred. The remaining parameters (“Min. Mapping unit”, “number of intervals”) are described in the article on creating fertilisation maps based on satellite images.
4. Specify the technical parameters
In the following panels you can specify:
– the product you are going to use – choose a fertilizer from the list to find out how much pure ingredient will go into the field, or choose the option “Other”.
– Financial parameters – enter the cost of agrichemicals so that the system can calculate whether and how much you save by varying doses.
– Equipment – enter the terminal on which you will use the map. This step is particularly important – the brand and model of the terminal has an impact on the type of files generated.
After filling out everything, click on the “Save” button. – the system will start to generate a map based on the set parameters.
5. Make sure the map generated fits your needs
In the graph on the right you will see what doses you will apply on what area. Below the graph you will see the variable rate map itself.
Important information when assessing the map is the savings varying doses bings – you can calculate this at the bottom left. Change the “Reference dose” to compare the treatment to fixed fertilisation.
If the field division into zones does not suit you, click on “Edit” at the bottom left. You will be able to change all the parameters you have given in step 3.
If the field division suits you, but you would like to change the doses in a particular zone, click on the “Edit” button at the top right of the graph.
After making the changes, click on “Save”.
6. Download the Variable Rate map
If everything makes sense, click on the “Download” button and select “Terminal Format” from the list. The map files in the appropriate format will be downloaded to your computer.
 Platforma