12/04/2019
A well made prescription map (also called an application map or VRA – variable rate application) can save you a lot of money when fertilizing your field while ensuring your crops receive the nutrients they need. Current satellite imagery serves as a particularly useful basis for such maps, especially in the case of nitrogen fertilization. To create a satellite image based prescription map, follow these 6 steps:
1. Choose an image
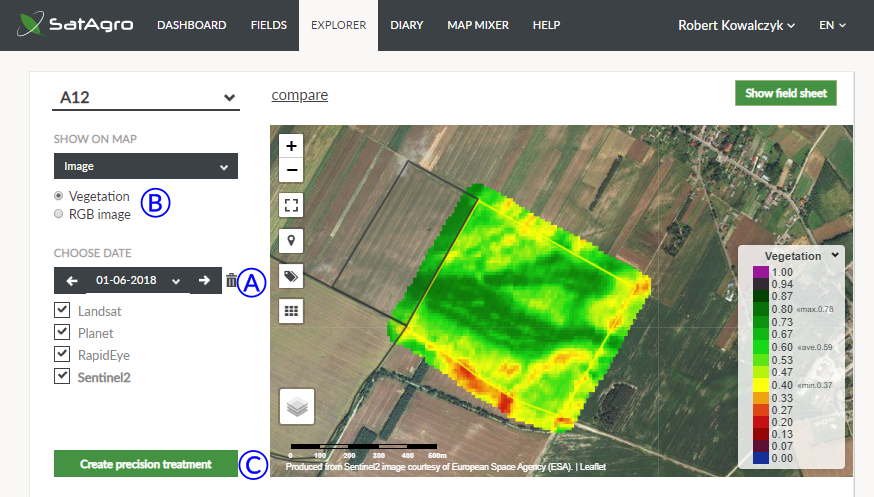
The map will be based on the satellite image you choose in the SatAgro “Explorer” (A). We recommend using data acquired by Sentinel2 satellites or commercial data available in the Premium subscription. Sentinel-based maps are more detailed than when using Landsat images and better illustrate the varying condition of your crops.
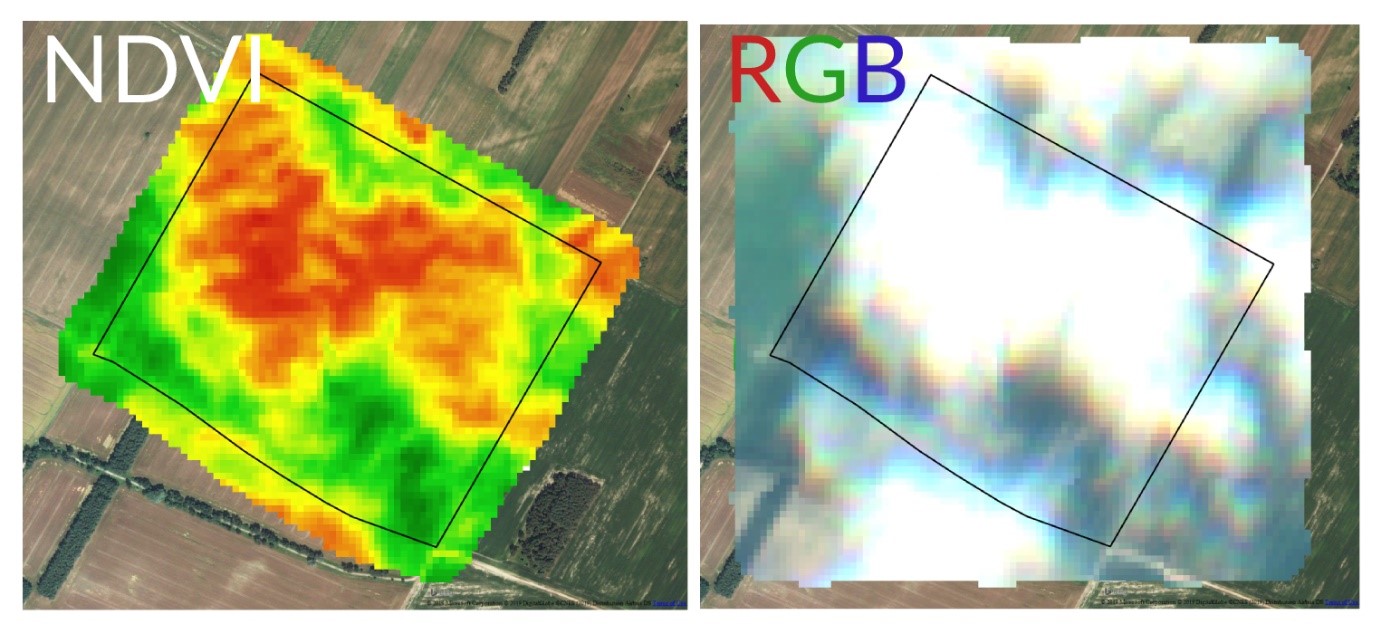
Remember to check for clouds and their shadows in the RGB photo (B) – we strive to filter out clouded imagery, but every now and again some will get through.
2. Enter the Precision treatment creator
After you’ve chosen the image you want to use, click on the button to the lower left of the map area (C). We are now in the Precision Treatment creator, where at the top of the page we can specify the map’s title, date and description.
3. Choose key parameter values
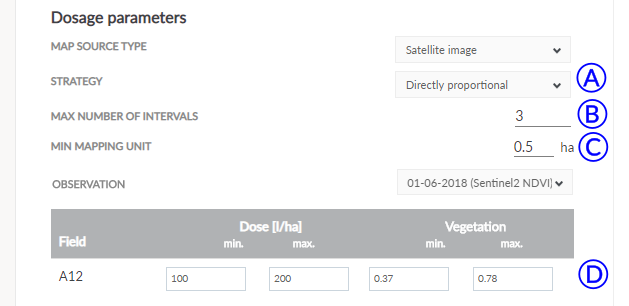
The Dosage parameters panel is where we enter a set of key parameters that will influence how the field will be divided into zones and where fertilizer will be directed. You will be able to edit and adjust these values later to create your desired result.
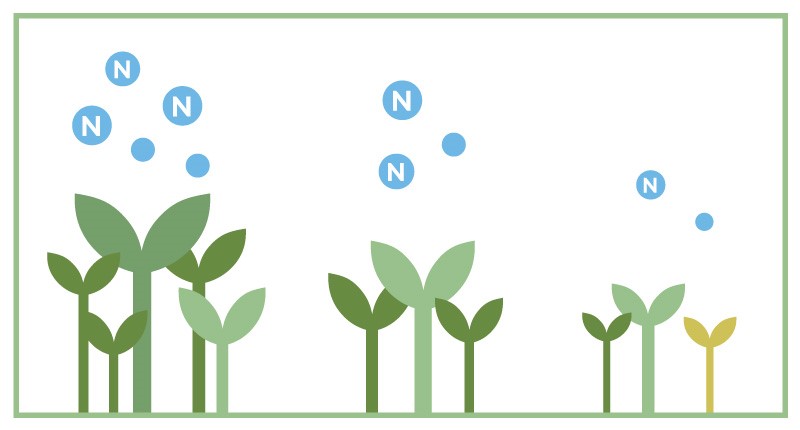
The most important decisions we have to make in the process is choosing the dose scaling strategy (A). The “inversely proportional” (or leveling) scaling strategy will assign higher fertilizer doses to areas with a low vegetation index:
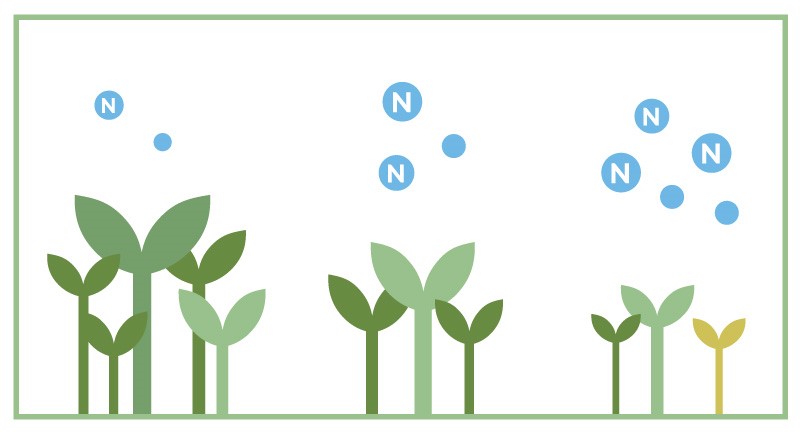
Conversely, the “proportional”, or qualitative, strategy will assign higher doses to areas with healthier plants:
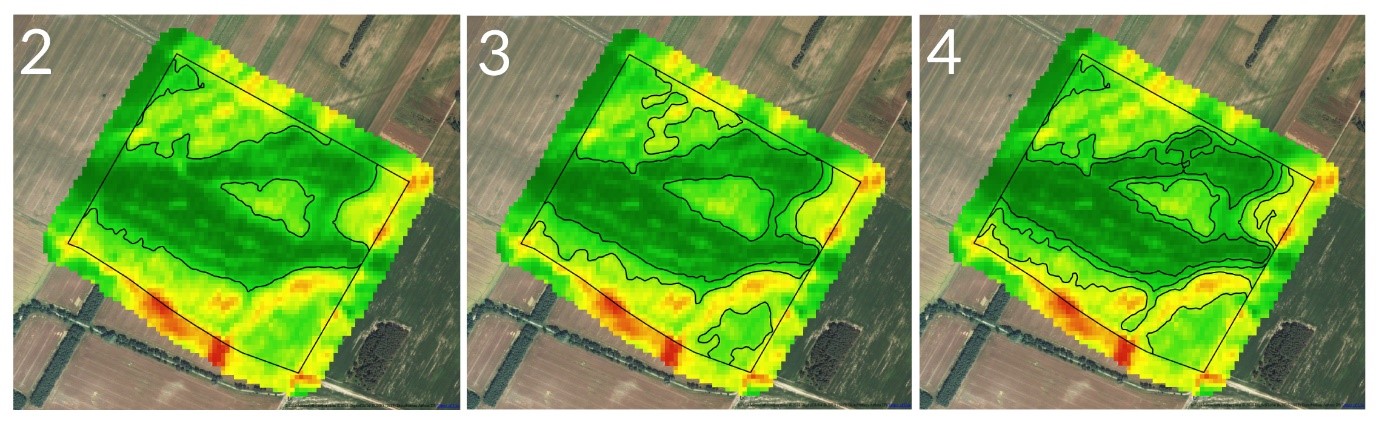
The “Max number of intervals” (B) and “Min mapping units” (C) parameters determine how detailed the map will be. Below you can see a comparison of maps generated with the “Max number of zones” parameter set to 2, 3 and 4:
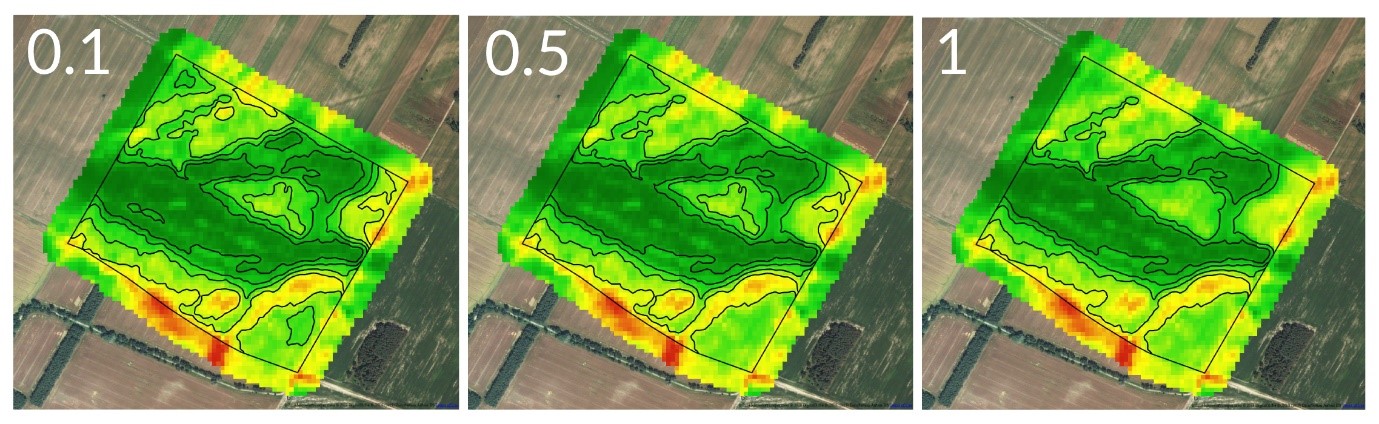
The “Min mapping units” parameter let’s you set the minimum area of a single zone. In the image below you can see a map with the “Max number of zones” set as 5 and the “Min mapping units” parameter set to 0.1, 0.5 or 1:
Next, it’s time to enter dose information (D). Specify minimum and maximum doses of the agrochemical you intend to use. If you want to e.g. increase the area with the lowest fertilizer dose, adjust the minimum and maximum Vegetation index values next to the Dose values (see: How to exclude parts of your field from fertilization). The “Adjust to mean” option is useful if you have a set amount of fertilizer you want to distribute over your field. The app will automatically adjust doses to achieve your specified mean fertilizer use.
4. Enter technical information
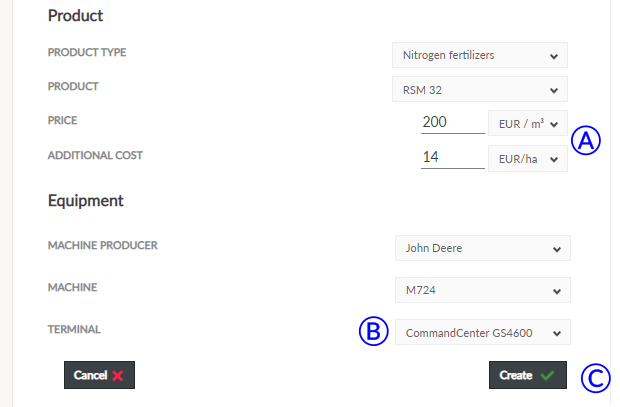
The “Product” panel holds information about the technical parameters of the event. You can choose the fertilizer brand from drop down lists or add one manually by clicking the „Other” option. The estimated price parameter will be used to calculate the amount you’ve saved by varying the doses of fertilizer (A).
The “Equipment” panel is where we specify what machine and computer we plan to use the prescription map with (B). This information is very important, as some onboard computer manufacturers require prescription maps with specific file structures – the SatAgro system will prepare prescription maps adjusted to your make of hardware.
When you’re done, click on the “Create” button to finish (C).
5. Inspect the map
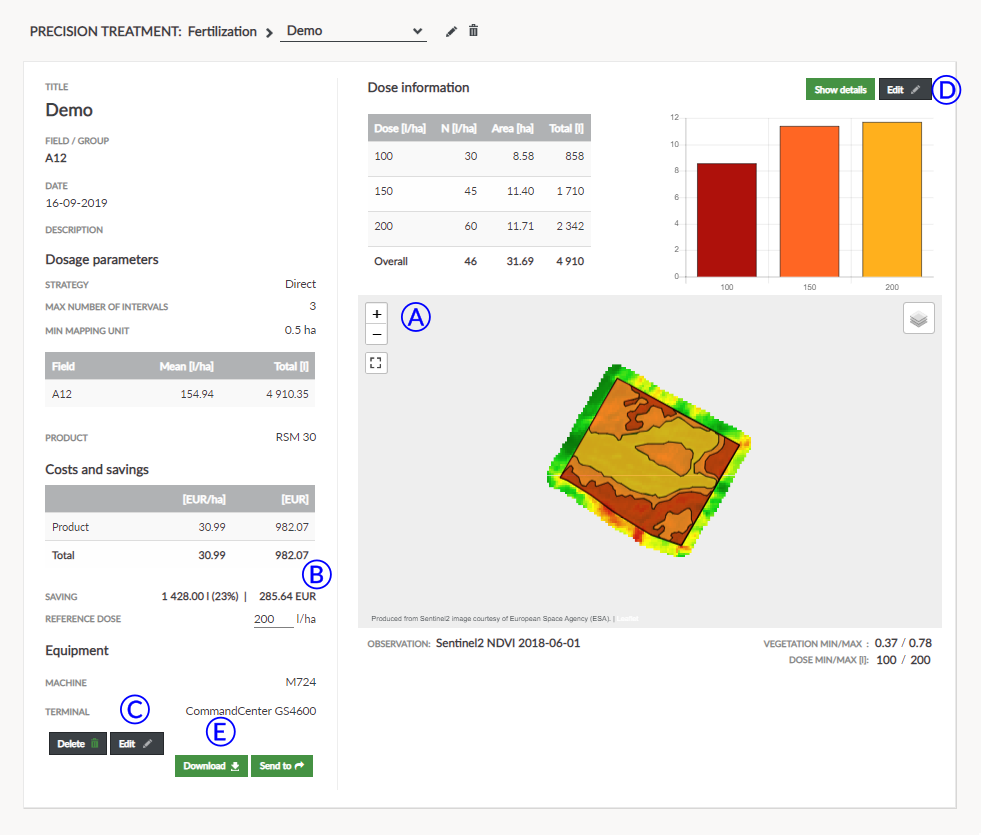
You can now view how the field was divided into zones in the panel to the right of the screen (A).To adjust any aspect of the finished map, click on the “Edit” (C) button. To manually set dosage in a given zone, click on the “Edit” button in the upper right (D). This lets you to for instance, forgo fertilizing some parts of your field altogether by setting the dose to 0. On the lower left you can see how varying your fertilizer doses has changed overall fertilizer use (B).
6. Download the map
If you are satisfied with how the map turned out, click the “Download” button (E).You will be offered a selection of file formats. For most use cases, choose the “Terminal’s format” option – the files will be adjusted to your make of hardware.
 Platforma