12/04/2019
SatAgro aims to make satellite data accessible to all – we develop processing chains for a variety of satellites, transform and process the data as it becomes available and deliver the resulting images, cropped to your fields, to your account. You can see the images in the Explorer tab. A peak behind the scenes: at SatAgro we call these field images “cookies”. The satellite images that can be viewed in SatAgro come from a number of public and private satellites.
Satellites available in SatAgro
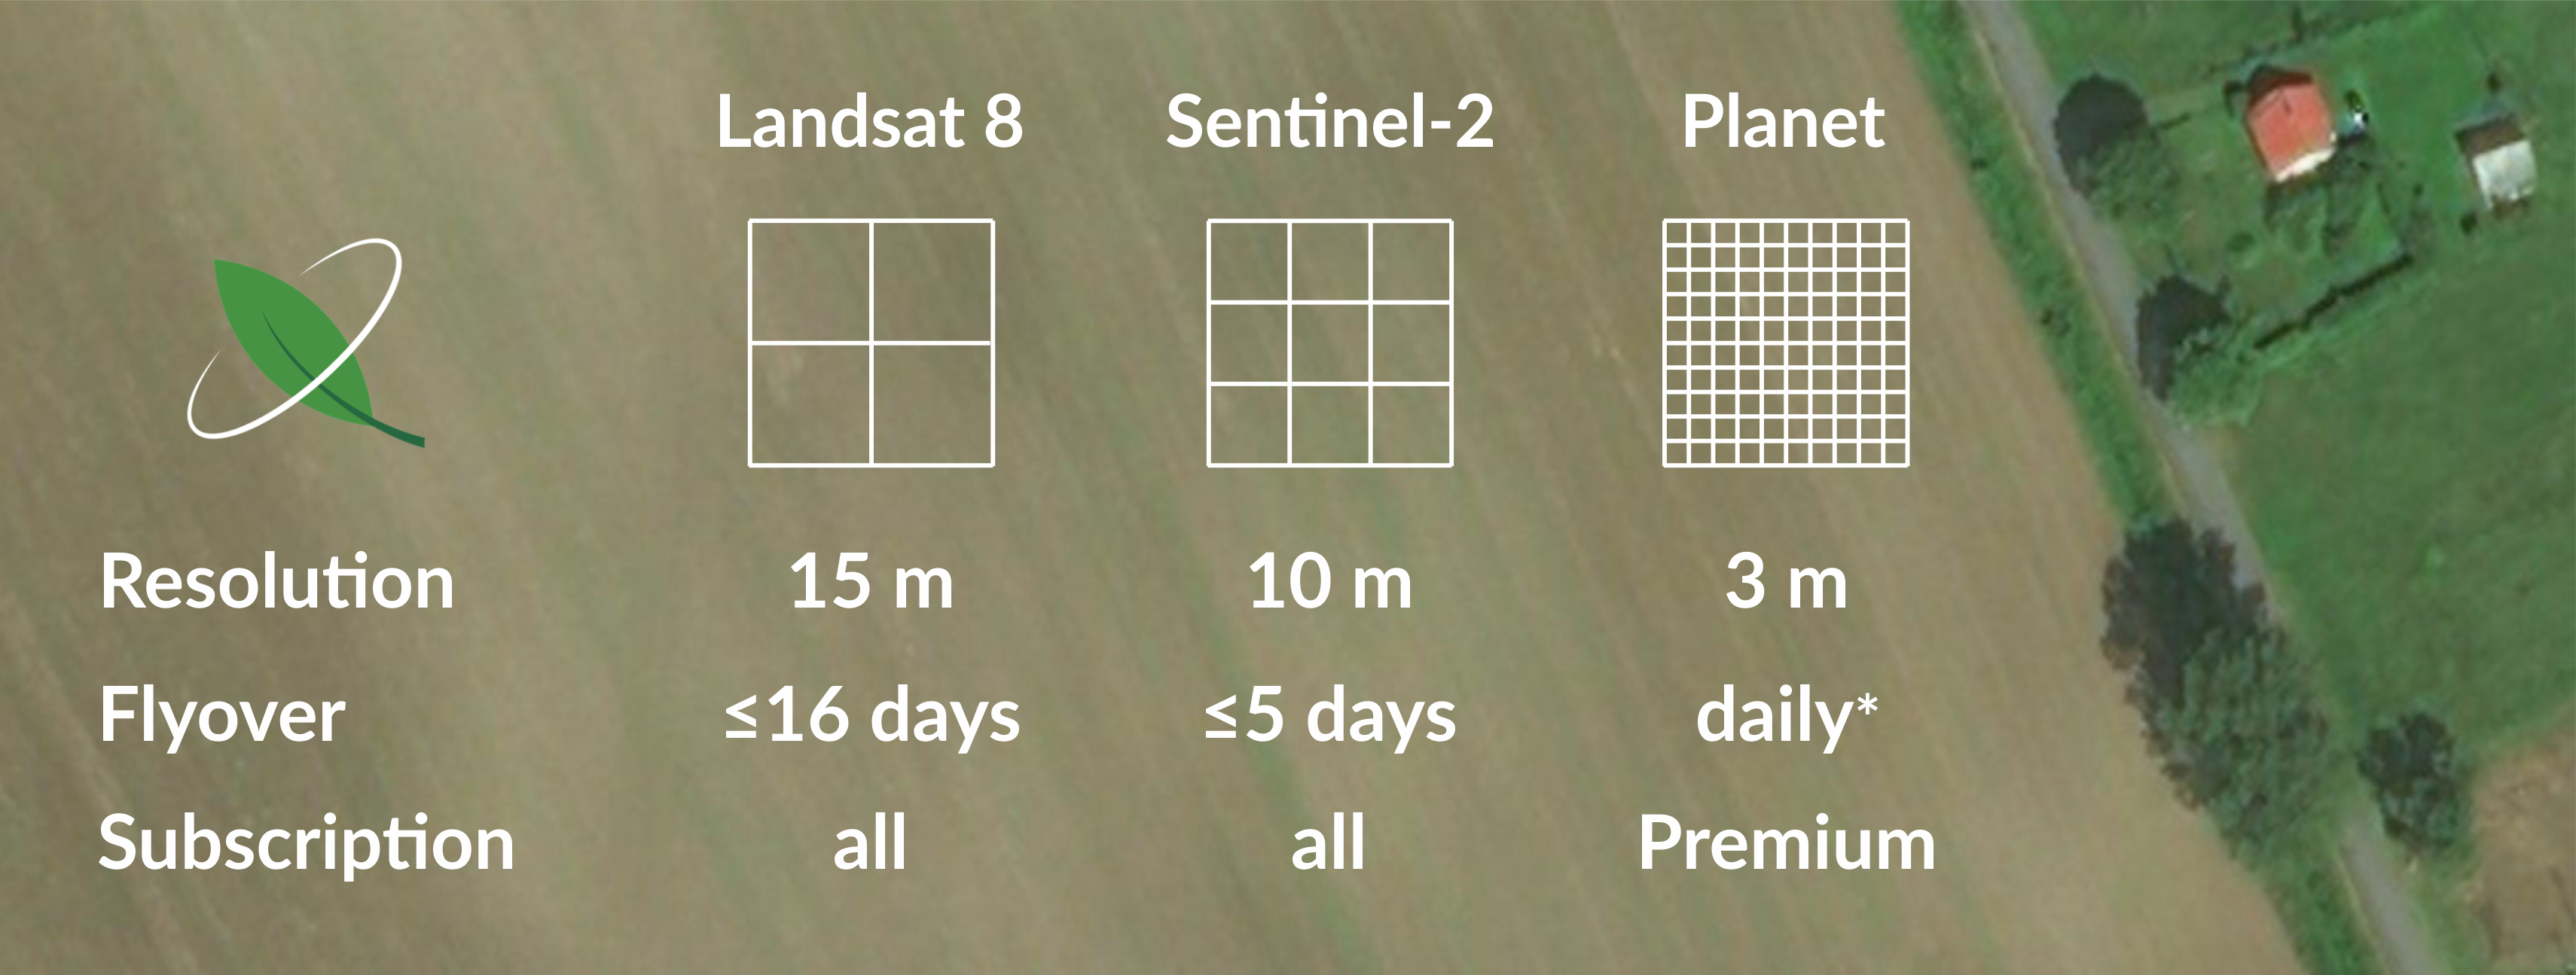
Landsat 8 – launched by NASA and the United States Geological Survey (USGS) in 2013, the satellite is the most recent addition to the longest running Earth Observation (EO) programme – the first Landsat was launched in 1972.
When compared to other satellites available in SatAgro, the 15 m resolution and 16 day revisit cycle of Landsat 8 may seem unimpressive. As EO enthusiasts, we will forever have a place in our heart for Landsat satellites as pioneers of the industry, but we do recommend using other imagery as a basis for VRAs.
Sentinel-2A and 2B – launched in 2015 and 2017 as part of the European Commission’s European Space Agency (ESA) operated Copernicus EO Programme. The two Sentinel-2 satellites boast higher resolutions and more frequent flyovers. Two more Sentinel-2 launches (C and D) are expected in the early 2020’s, providing continuity after the old ones deorbit.
For most agriculture related applications, the 10-meter pixels in Sentinel imagery are sufficient.
Planet data – In the European Union, we offer access to Planet data. Planet Corporation is one of the companies taking part in the microsatellites revolution. Instead of launching a single, science-grade satellite that weighs approximately a ton into orbit, Planet launches multiple, far lighter micro-satellites at a time. The company now has ~150 satellites in orbit.
Planet satellites capture images of the entire world daily, at higher resolutions – even going down to 3 meters. As part of the SatAgro Premium subscription plan, you get access to the best image of the week. In periods when the last image has been captured more than 6 days earlier, you get the first successful image capture that happens. The daily fly overs do not guarantee successful image acquisition, but make it much more likely.
MODIS – MODIS data can be viewed in the chart area of the Explorer (variable: Vegetation EVI). The advantage of MODIS data are very frequent flyovers (daily in the morning and evening) and a record going back to 2002, but due to the low resolution of MODIS data it is not suitable for precision agriculture use – the values visible in the chart are averages for the entire field.
 Platforma